2 Displacement
2.1 Definition of gentrification
Gentrification is a process, which is defined differently using various indicators. For example, a study for Seattle defined gentrification with low income and education increase while other study for Indianapolis did it with low income and growth in home value and education. Furthermore, the result of gentrification, for example eviction, could be the indicator to define gentrification in that indicators and causes could be different.
Suggested causes for gentrification - for the tracts with higher vulnerability (with respect to renters, education, income, and race), would be infrastructure investment or development because this will lead to demographic changes, and neighborhood condition, housing market, and economic changes.
Neighborhood change - “Broad term used to capture the full spectrum of economic, racial or ethnic, and structural changes in a geographic area, both positive and negative. Neighborhood revitalization is a related term that implies change viewed as positive, usually accompanied by new public or private investment” (Cohen and Pettit, 2019).
Gentrification - “Transformation of areas historically inhabited by marginalized groups, usually racial or ethnic or class groups, into areas used by the dominant class or racial or ethnic group. Usually characterized by increased investments in areas that have seen long-term disinvestment” (Cohen and Pettit, 2019).
Displacement - “Forced or involuntary household movement from place of residence. Usually expanded beyond formal forced moves such as evictions to include unaffordable rents or poor living conditions. Displacement is distinct from residential mobility, which includes voluntary household movement” (Cohen and Pettit, 2019).
2.2 Gentrification indicators (causes)
There are historical indications of displacement, such as “transportation investment, percent of rent-burdened households, and availability of affordable housing” (Bousquet, 2017). Those are divided into two categories: (1) demographic variables, and (2) physical variables.
Yonto and Schuch (2020) mentioned that “gentrification patterns may vary based on the definition, spatial unit, and variables used to identify gentrification. Combining demographic and physical factors drawing on both the physical and sociodemographic variables and combining qualitative and quantitative methods to produce a more holistic consideration of complex socio-spatial phenomena (i.e., gentrification) would be helpful.”
2.2.1 Demographic variables
- Vulnerability - race, renters, education, income, children in poverty
- Demographic change - income, proportion of white, education, home ownership
2.2.2 Physical variables
- Housing markets - housing type, home value, sales, rents, vacant, blighted, public and subsidized, evictions
- Economic status - business activities, building and demolition permits, capital investments
- Neighborhood condition - transit use, crime, safety
- Housing market change - accelerating (low present home value, high recent appreciation since 2000), appreciated (previous low home value, high present home value, high appreciation since 1990), and adjacent (low home value touching a track with high present home value or high appreciation since 2000) (“Gentrification Mapping Methodology,” 2020)
2.3 Various presentation of gentrification
Different data inputs create different analysis outputs. For example, a study for Seattle identified “10,000 census tracts in 100 large cities that had incomes below the area median in 2000 — these tracts were deemed “gentrifiable.” These tracts experienced the biggest increase in the percentage of college-educated residents by the 2010-2014 period. The tracts that were in the top 10% for this increase were identified as gentrifying." (“Seattle is the third,” 2019).
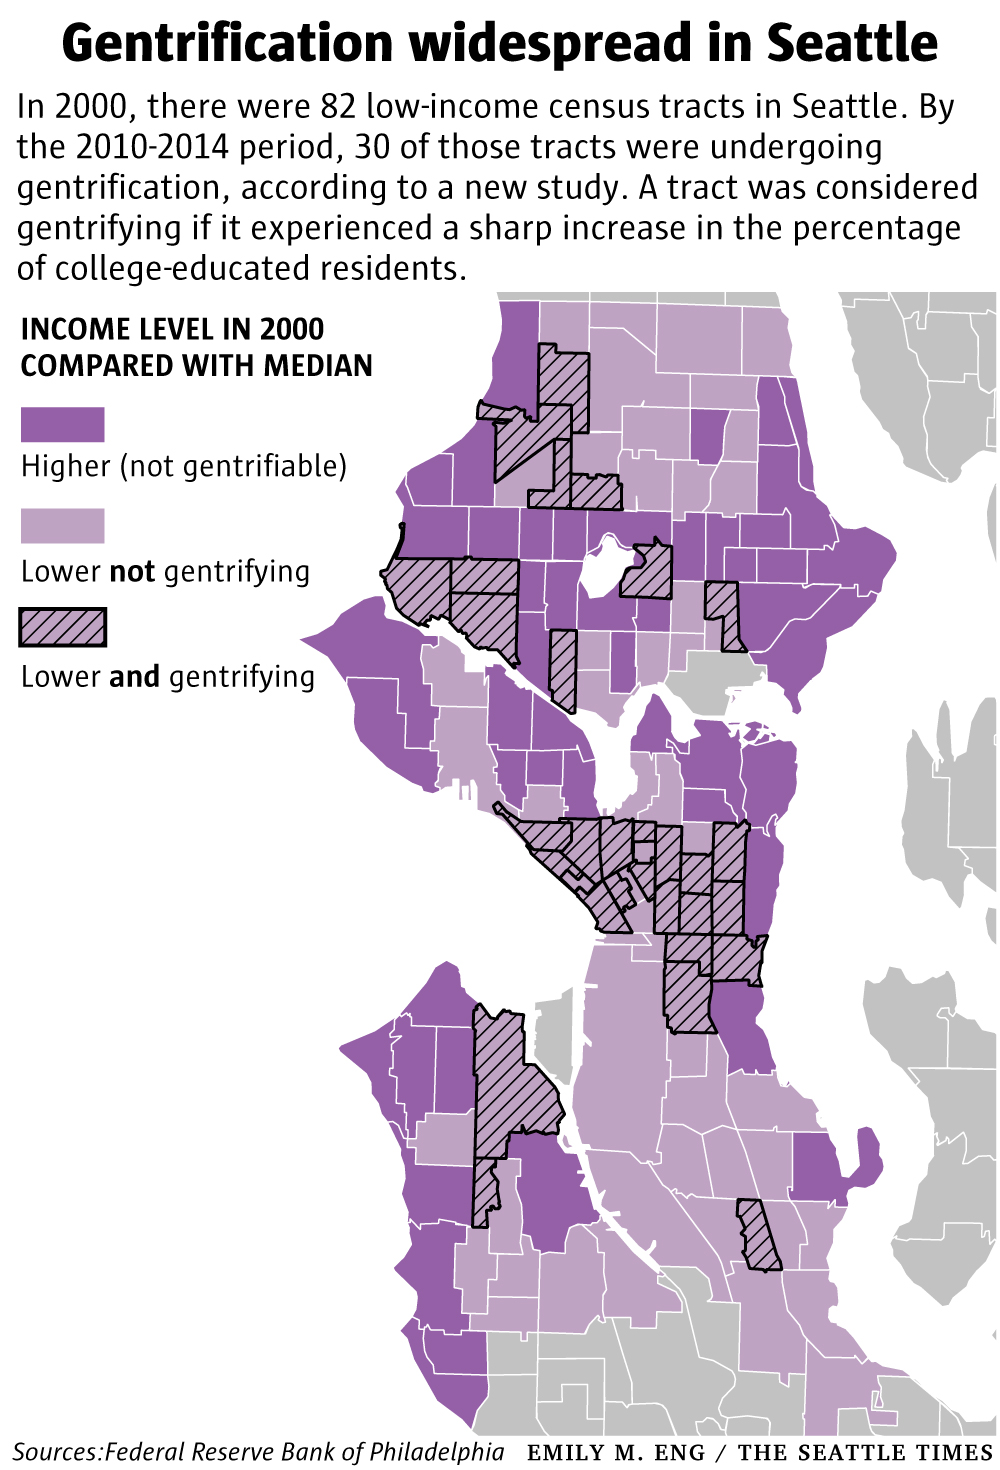
Source: “Seattle is the third,” 2019
On the other hand, a study for Indianapolis identified gentrifying tracts:
- Low income with significant growth in home values and education, not gentrifying tracts
- Low income with no growth, and not eligible tracts
- Mid-upper income tracts
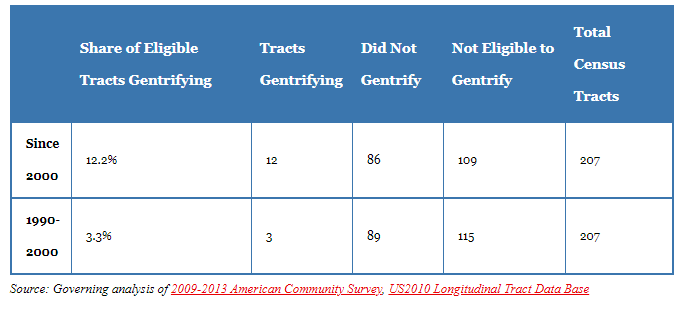
Source: “Indianapolis Gentrification Maps and Data.” 2015
Puget Sound Regional Council developed displacement risk mapping based on the five categories: socio-demographics, transportation qualities, neighborhood characteristics, housing, and civic engagement.
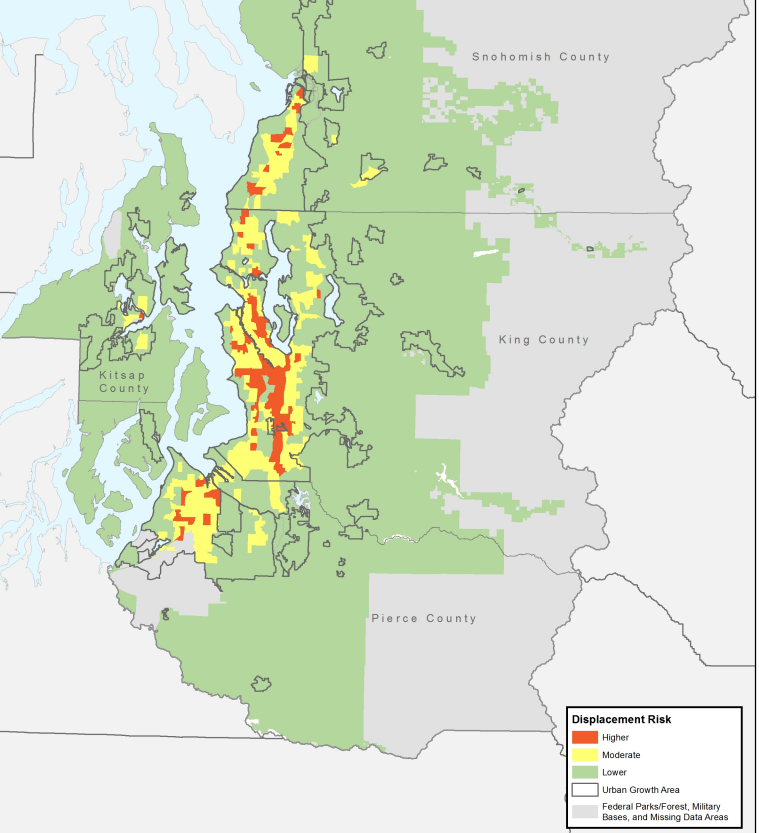
Displacement risk in King County (Source: Puget Sound Regional Council)
2.4 Gentrification in Seattle
Furthermore, a study for Seattle used opportunity index, “which identifies the level of economic opportunity in each neighborhood based on public data on education, access to jobs, transit availability, presence of civic infrastructure, and proximity to health facilities and healthy food. Combining displacement and opportunity ratings, Seattle categorized neighborhoods in four strata: high displacement risk/low access to opportunity, high displacement risk/high access to opportunity, low displacement risk/low access to opportunity, and low displacement risk/high access to opportunity.” (“Where is Gentrification Happening,” 2017).
2.4.1 Displacement index
- Communities of color
- Low English-speaking ability
- Low educational attainment
- Renter households
- Housing cost-burdened households
- Low household income
- Proximity to frequent bus service
- Proximity to light rail or streetcar
- Proximity to core businesses
- Proximity to school, park, community center, or library
- Proximity to affluent or already-gentrified neighborhood
- Proximity to regional job center
- Development capacity
- Median rent
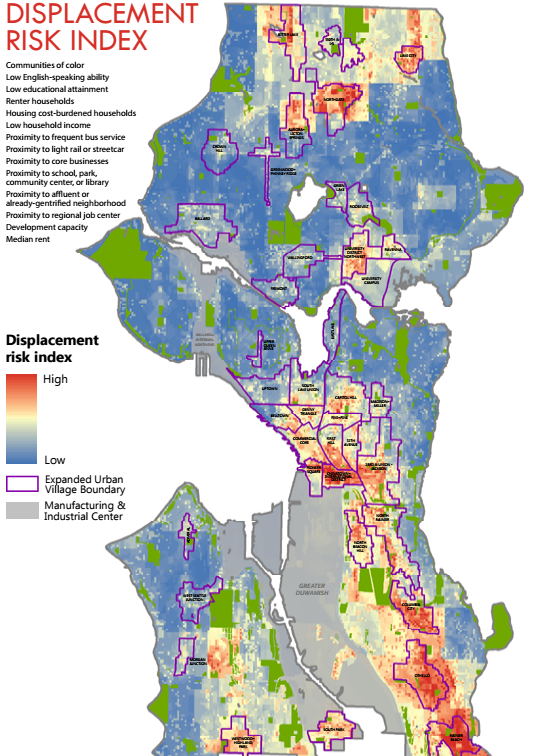
Source: “Where is Gentrification Happening,” 2017
2.4.2 Opportunity index
- High performing elementary and middle schools
- High school with above-average graduation rate
- Number of jobs within 2 mile radius
- Increase in median home value
- Proximity to frequent bus service
- Proximity to light rail or streetcar
- Proximity to a library
- Proximity to a community center
- Proximity to a park
- Proximity to a public health facility
- Access to fresh produce
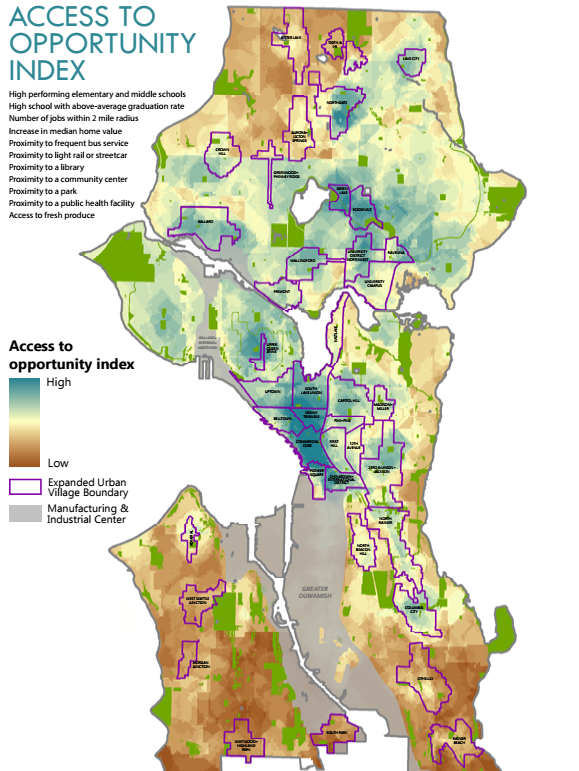
Source: “Where is Gentrification Happening,” 2017
The two indexes share elements because the indexes are not mutually exclusive nor collectively exhaustive. This is common because a place with opportunities would be wanted so that this would incur displacement of some population. In the meantime, Displacement index focuses more on vulnerability while Opportunity index does on expected advantages.
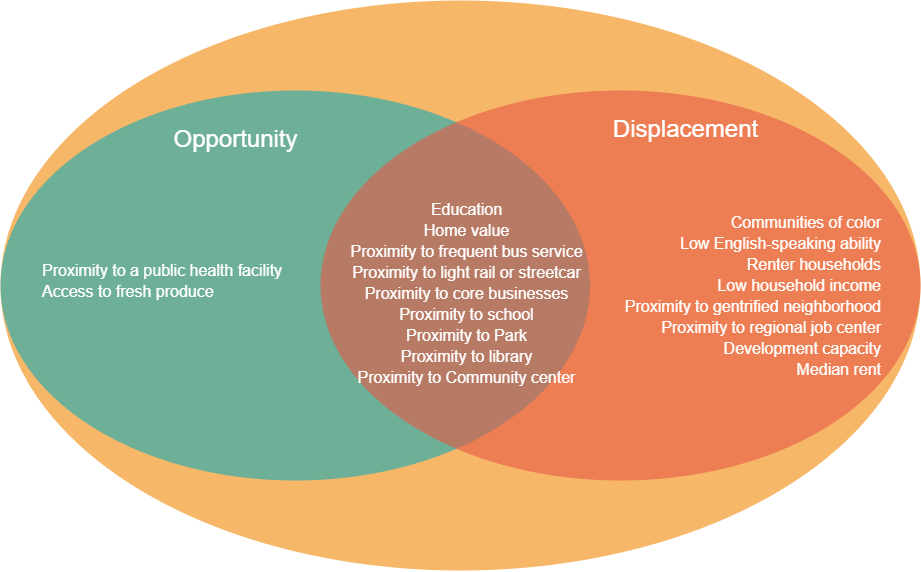
Displacement and Opportunity indexes)
Seattle categorized neighborhoods in four strata: high displacement risk/low access to opportunity, high displacement risk/high access to opportunity, low displacement risk/low access to opportunity, and low displacement risk/high access to opportunity.” (“Where is Gentrification Happening,” 2017).
There are places with lower Displacement and Opportunity indexes such as West Seattle Junction, and Morgan Junction as indicated below figure. The two indexes are useful to analyze gentrification with identification of places in Seattle.
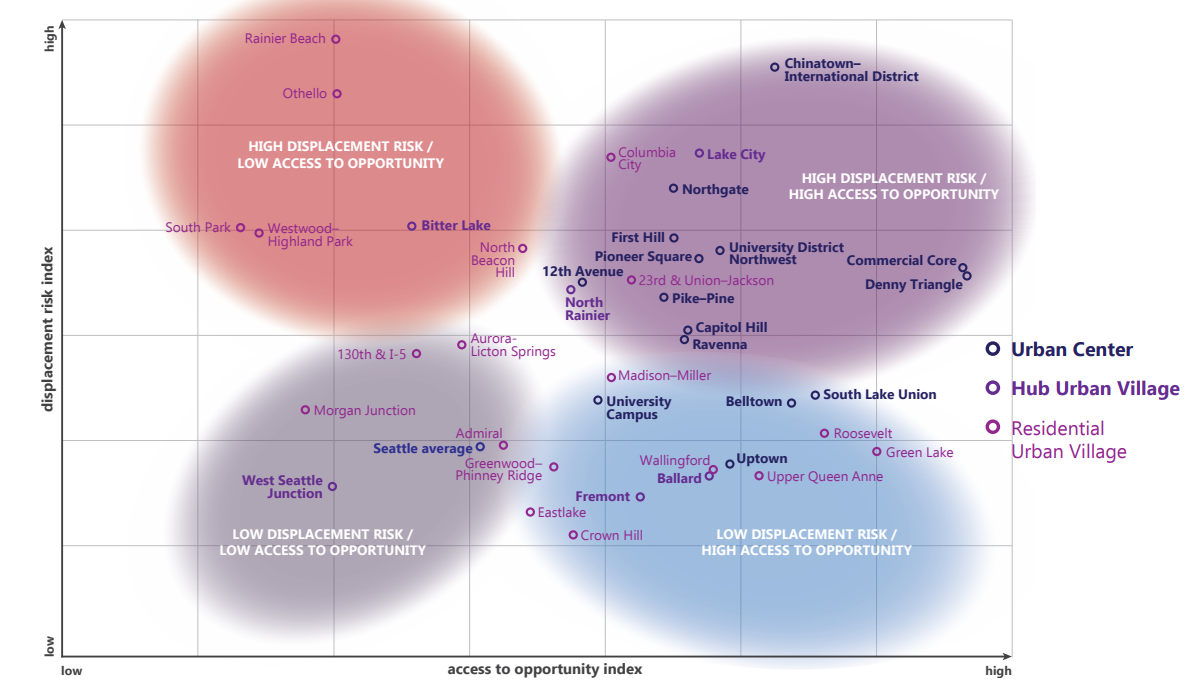
Displacement and Opportunity indexes (Source: “Seattle 2035 Your City, Your Future,” 2015)
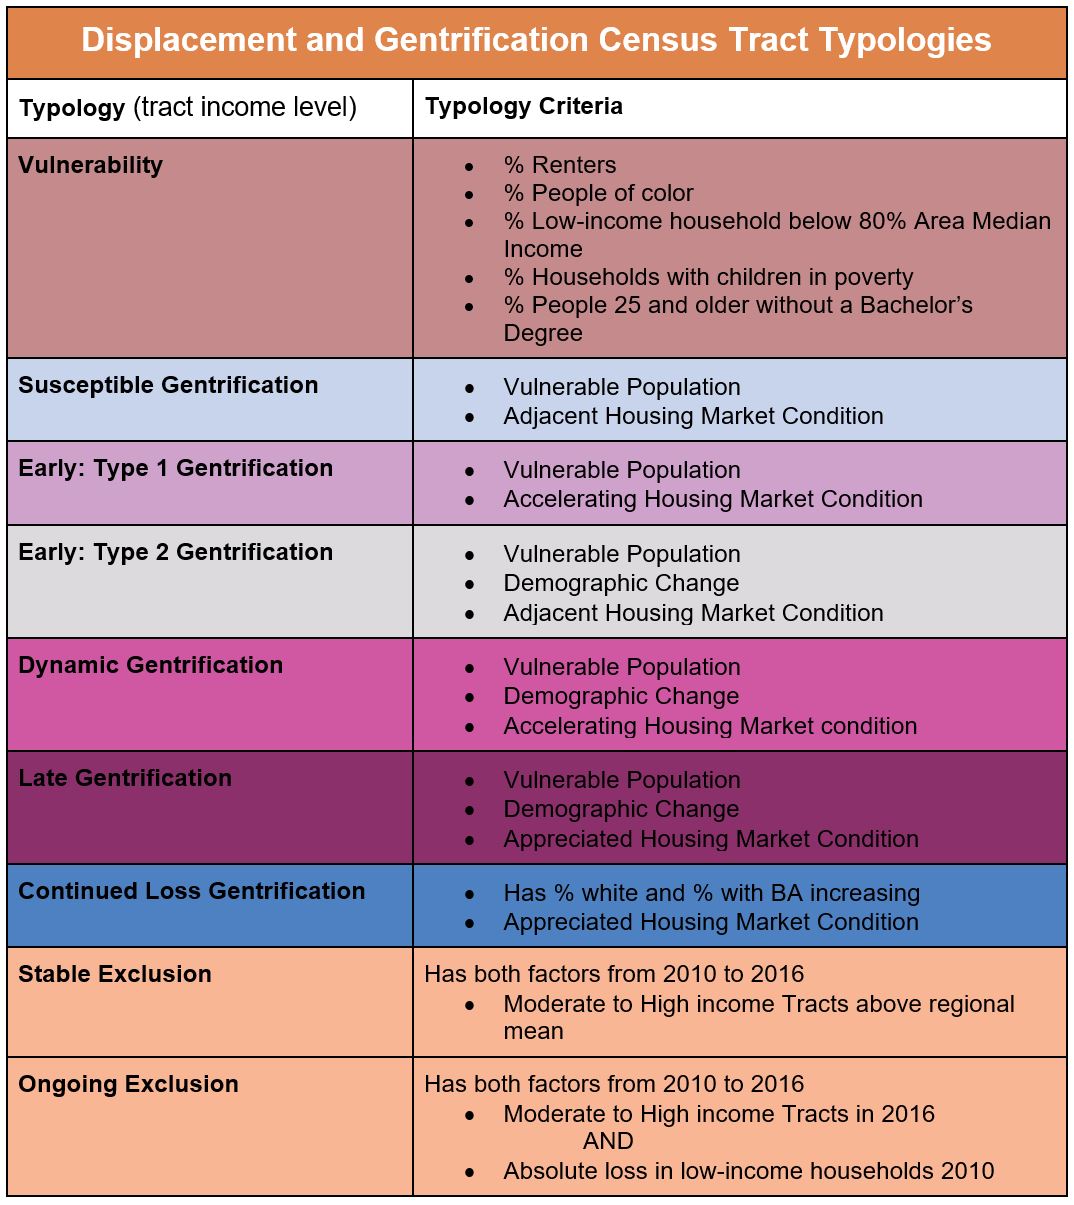
2.5 Categorizing
Based on the income level and changes of demographic and physical variables, gentrification could be identified with whether is is at risk or ongoing gentrification.
Low income categories - no change, at risk (having development factors), ongoing gentrification(loss of low income households)
Moderate and high income categories - advanced gentrification, no change, at risk, ongoing, advanced exclusion (low income migration rate)
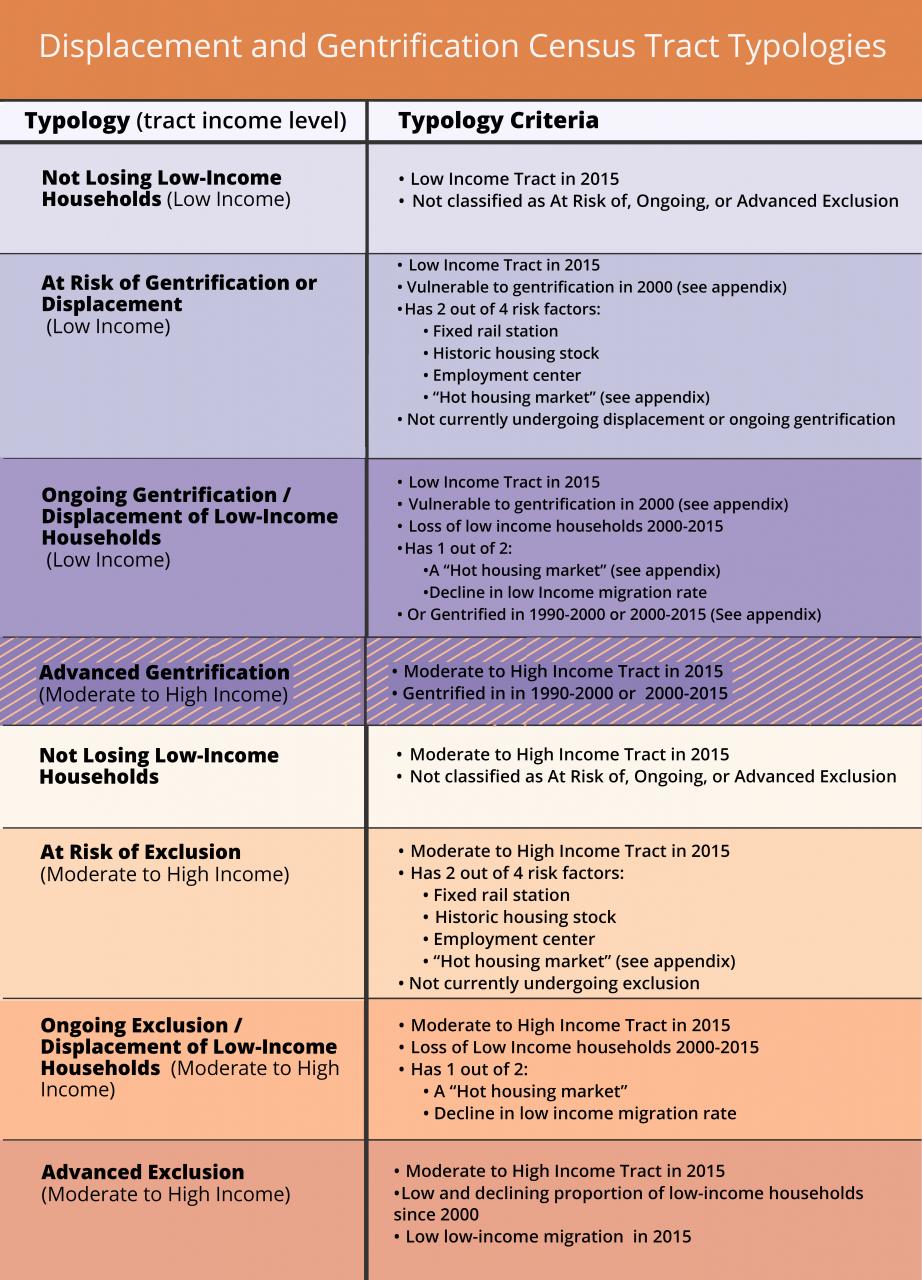
Source: “Urban Displacement San Francisco Map | Urban Displacement Project,” 2020
A study specifying the patterns described above into six categories: susceptible, early type 1, type 2, dynamic, late and Continued Loss tracts ( non-vulnerable tracts) based on demographic change, real estate value, and appreciation.
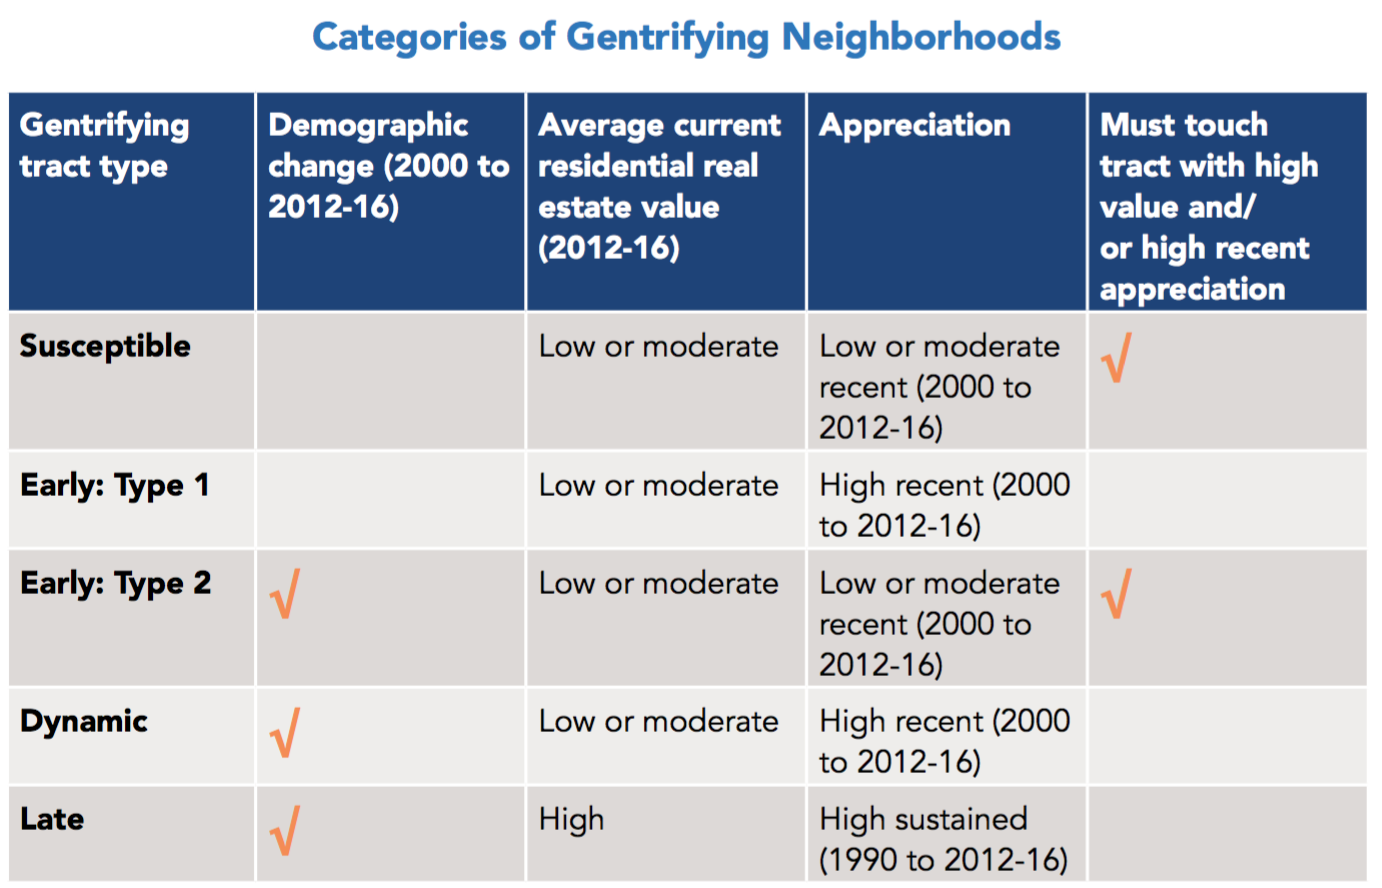
Source: “Gentrification Mapping Methodology,” 2020
Source: “Urban Displacement Austin Map | Urban Displacement Project,” 2020
“Gentrification Mapping Methodology” (2020) mentioned, “Susceptible tracts have not experienced demographic change, and are in areas adjacent to ones showing signs of housing market appreciation. Early: Type 1 tracts have not yet experienced demographic change but are experiencing an accelerating market. Early: Type 2 tracts are the other way around: they have experienced demographic change but are not yet accelerating and instead are next to an accelerating or appreciating tract. Dynamic tracts have experienced demographic change and are experiencing accelerating market conditions, whereas Late tracts have also experienced demographic change but are in an appreciated housing market state. Finally, among non-vulnerable tracts, Continued Loss tracts, in addition to having recently experienced an increase in their white and college educated populations, are in an appreciated market condition.”
2.6 Challenges
There is a study comparing the four methods of mapping gentrification. They showed different analysis outputs that the result would be different depending upon which method was used. However, there was one variable which the models agreed that all at-risk area had a greater share of evictions. Furthermore, only two variables (i.e., income and education) were shared in all four methods.
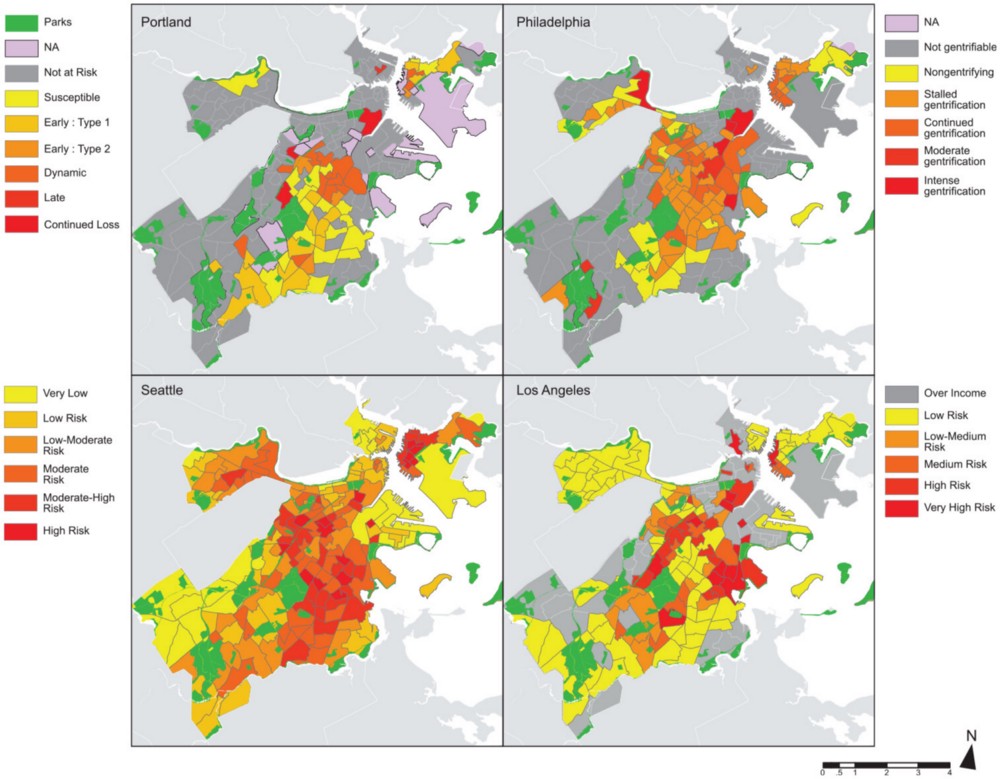
Source: Preis et al., 2020
2.7 Suggested indicators
The main indicator for gentrification is public and private investment because it leads to built environment change followed by demographic change. Capital investment on projects such as expanding urban village, developing business center for companies, establishing state public educational institutes, etc. will change the built environment and cause demographic change due to the job creation. This phenomenon will increase property value of housings adjacent to the development and finally property tax will increase. The state property tax in turn goes back to the City of Seattle for the projects of further development according to the capital improvement plan (CIP).
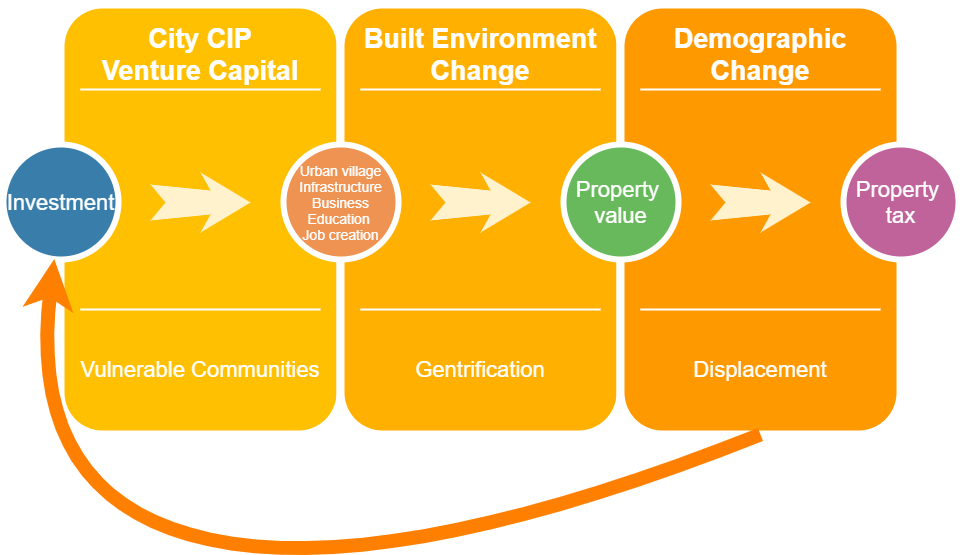
Gentrification cycle
Four indicators are suggested with respect to the argument above:
- Vulnerable community index (race, renters, education, income)
- Urban village development (upzoning) index
- Proximity to jobs and nature (university, companies, waterfront, etc.)
- Higher housing value
There are other indicators such as distance to mess transportation, hospital, etc. But currently those are assumed to be less significant compared to the suggested four indicators. If time allows, regression models could be performed to test the significance of the indicators to explain gentrification and displacement.
2.8 Presentation of gentrification
It is necessary to map gentrification area and areas with risks to prevent displacement. The i-team from CA used “gentrification indices to assist with site selection for its Rent Stabilization Ordinance (RSO) outreach campaign, a marketing and awareness initiative to help tenants and landlords better understand and access city resources that can help longtime residents stay in their homes during periods of rising prices” (“Where is Gentrification Happening,” 2017).
Mapping gentrification could be helpful in terms of the current status quo and predictive manner.
Gentrification map - “Los Angeles Index of Neighborhood Change, a map that allows users to explore the degree to which zip codes in Los Angeles experienced gentrification between 2000 and 2014” (“Where is Gentrification Happening,” 2017).
Risk (prediction) map - “Los Angeles Index of Displacement Pressure, which repurposed much of the data from the neighborhood change project in addition to information from ESRI Community Analyst in order to predict neighborhoods where displacement was likely to occur” (“Where is Gentrification Happening,” 2017).
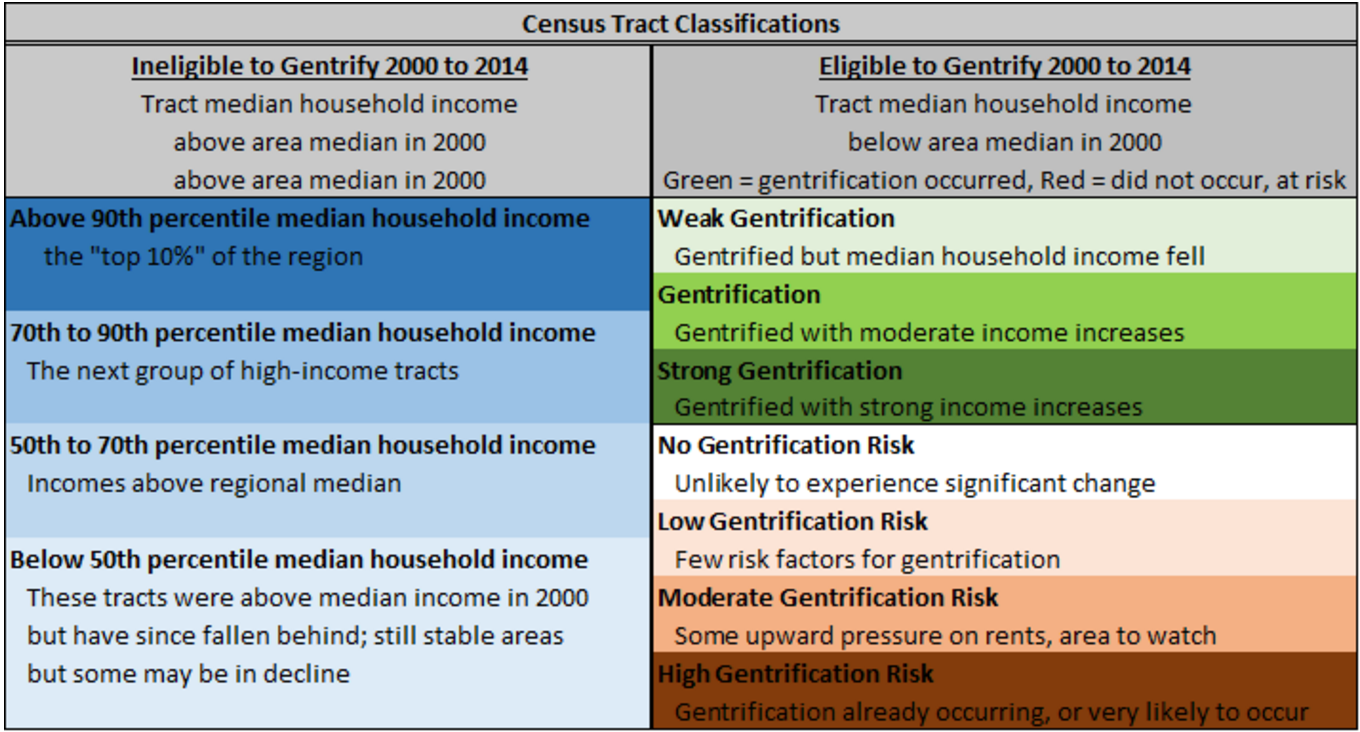
Infrastructure is also playing a significant role in gentrification. A study mapped neighborhood change and gentrification in the purple line corridor.
Blue: High income tracts
Green: Gentrification - “light, medium and dark based on income increase - defined as an increase in home prices, and the population’s education level, that was greater than the increases that occurred in the region as a whole. This map uses this methodology, but breaks down the areas that pass the gentrification test into three categories” (“Purple Line Corridor,” 2020).
Red: Risk of gentrification - not yet gentrification, but likely to happen - “these areas are at risk for accelerated increases in home prices and an influx of educated residents because they have seen, relative to other areas: greater increases in population, the proportion of the population that is white, median household income, education levels, home values, the number of housing units, rent prices, the home ownership rate, and decreases in the poverty rate. Areas that have good accessibility to jobs, both by automobile and transit, are at a higher risk to gentrify, as are areas that are within one mile of a rail-transit station, including new Purple Line stations” (“Purple Line Corridor,” 2020).
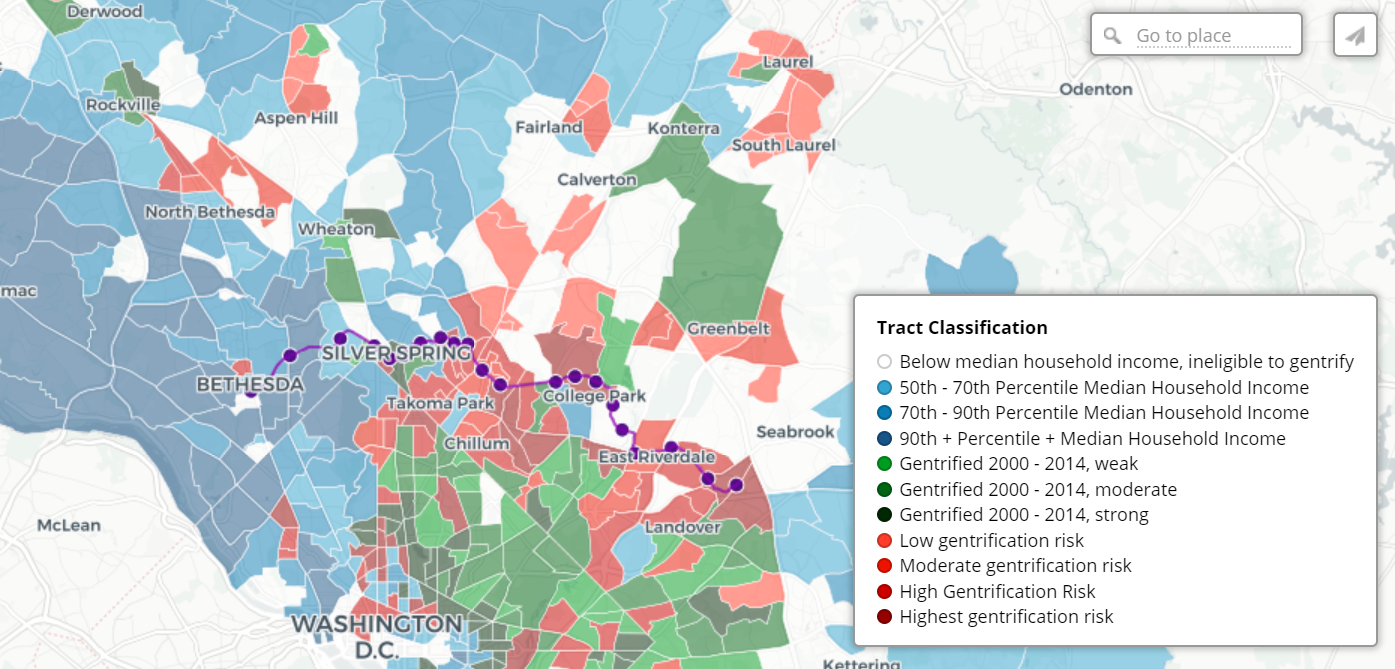
Source: “Purple Line Corridor,” 2020
Source: “Purple Line Corridor,” 2020
2.8.1 Mapping
Yonto and Schuch (2020) found mapping based on smaller scale such as parcel level rather than tracts is more accurate and preferred. Furthermore, density mapping such as kernel density version of the tax parcel maps were found to be preferred to point and census tract maps.
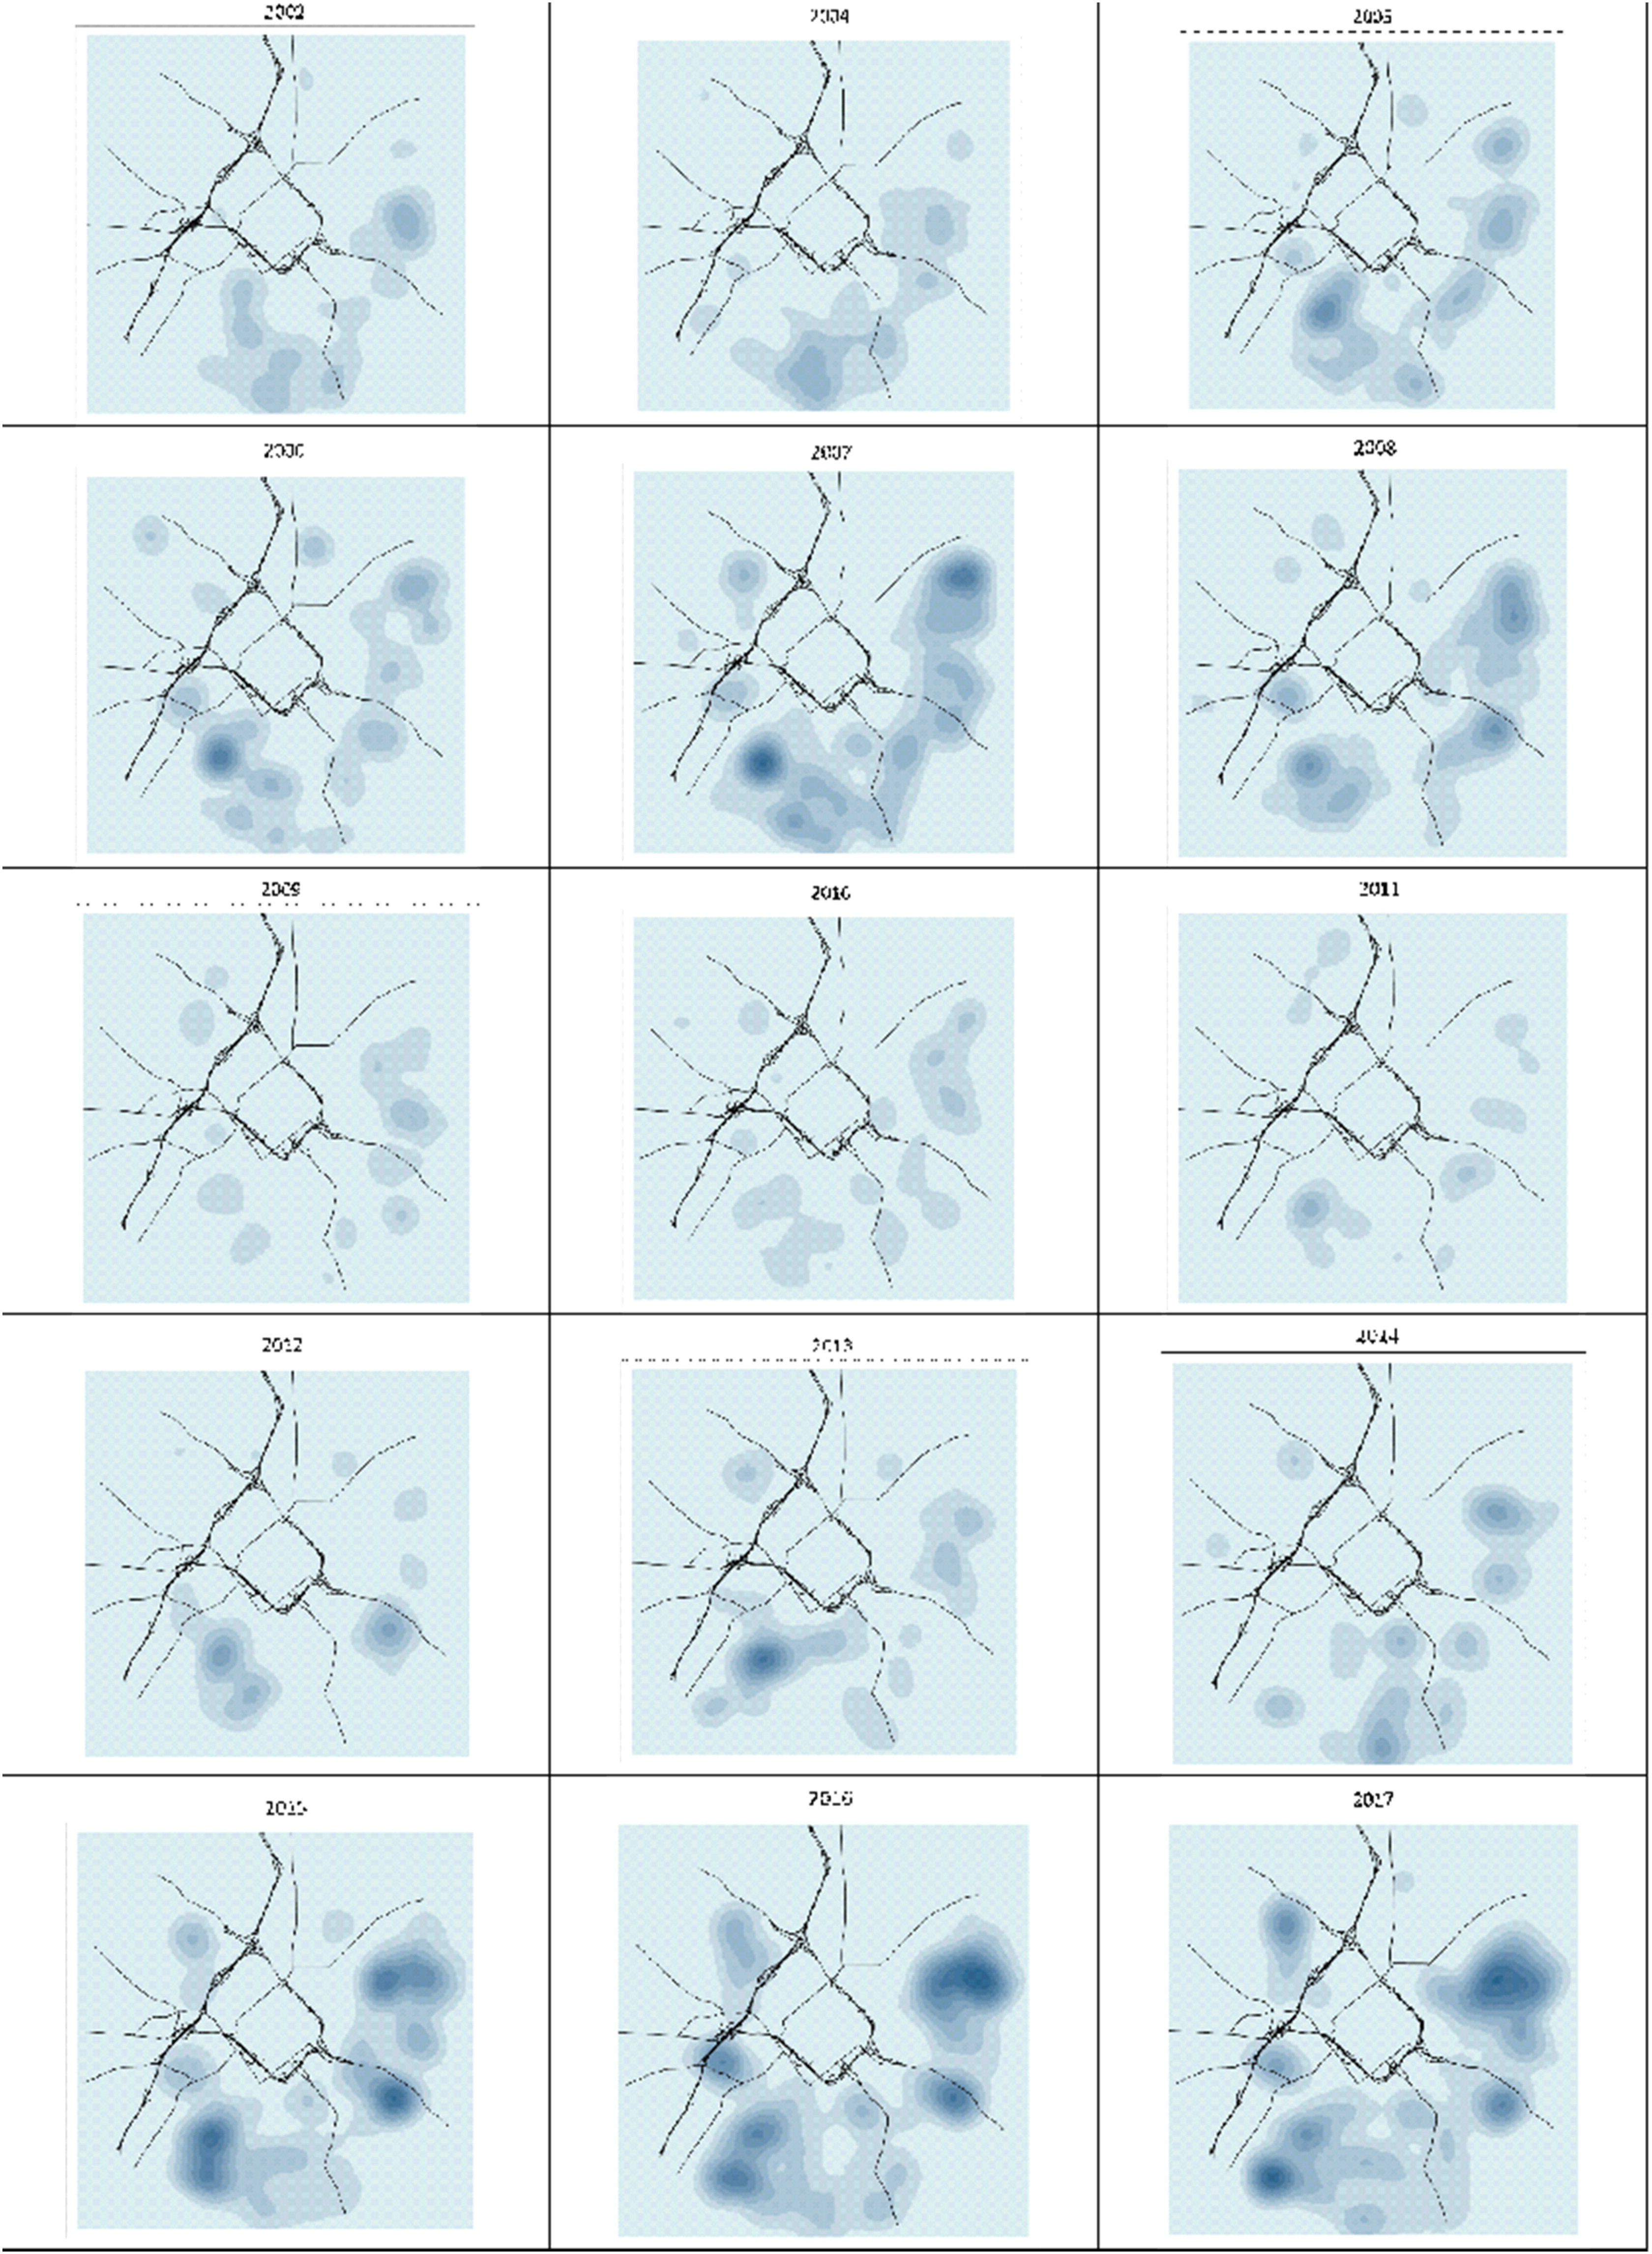
Source: Yonto and Schuch, 2020